Warning: this page is heavy on technical stuff! You are not required to read this page in order to use the service. Only read it if you'd like to know more about the research I did to create my trading strategies.
All the stock picks I post are based on a portfolio of trading strategies I developed. I've spent a number of years doing research trying to find trading strategies that are profitable. I did most of my research by performing back tests (click here to make sure you understand how back tests work). Here are my statistical criteria for adopting any given trading strategy.
First of all, I make trades across a wide variety of stocks and options that cover a diversified array of industries. This diversification lowers risk exposure.
A trading strategy must have great results over a back test of at least 20 years for me to consider it. The reason: we have seen a lot of different types of market conditions over that period. Straight up, straight down, sideways, and just about everything in between. I only consider a portfolio of strategies that may have held up through all those environments.
The strategy needs to have a lot of "raw edge". By that, I mean the strategy can't be one that only works well in back tests if I use, for example, a profit target of exactly 3.6% or something really specific like that. It needs to be a strategy that has back-tested profitability no matter what exact profit or loss criteria I use.
I do a "Monte Carlo" statistical test for each strategy. We may know the strategy could have done well over the last 20 years, but what if the order of wins and losses was different? The Monte Carlo test I run does 10,000 different random variations of ordering of the transaction profit results from the back tests. This allows me to see what the worst-case drawdown would have been in any possible hypothetical variation. Strategies need to satisfactorily pass this test, both individually and within the portfolio of all strategies, in order to be approved.
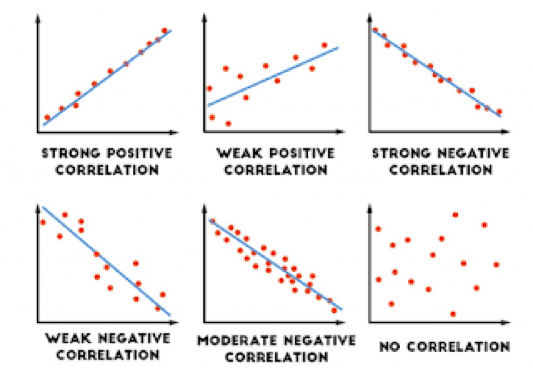
I do statistical correlation tests. Since I'm running a number of different trading strategies, my aim is that any two strategies are not too closely correlated. Otherwise there could be large sudden drawdowns at times due to multiple strategies failing at the same time. So I compare the statistical correlation between each pair of strategies. I've weeded out a lot of good strategies with this test, which is painful for me but which might give my overall portfolio of strategies much better diversity and safety.
I do out-of-sample tests. This means that instead of taking one historic sample of how a strategy could have worked and finding the perfect transaction entries and exits just for that period, I instead start with a smaller period and then separately run the back test on one or more separate periods. If the results of the back test are still strong in the separate period(s), then we're cooking.
I do standard deviation tests in the live portfolio. Once I have the trading strategies for a portfolio ready to go, I trade them live and monitor the results and compare them to their 20-year standard deviation lines from the back test results. As long as the current performance is within two standard deviations, then it passes the test and is performing as expected.
I make sure commissions and slippage are accounted for in my back tests. Slippage is when you enter an order to exit at, say, a price of 2500.00, but your actual executed price is, say, 2500.25. That difference is slippage. Also, transactions have fees (at least for options), and that fee is accounted for in all my quantitative research.

I check the Sharpe ratio of the back tested returns of my portfolio of strategies over time. This is the ratio that indicates how consistent the returns could have been by comparing the annual rate of return to the standard deviation of those rates of return. The smoother the distribution the better. An example: what if there were a portfolio that would have made you a millionaire over 20 years, but it had 19 years where it lost a little money and one year where it broke loose for a 10,000% gain. That's not the type of portfolio I'm interested in personally. I want one that is more consistent with profitability to the extent possible. That's where the Sharpe ratio comes in. It helps me gauge whether the returns are as consistent as I'd like them to be.
It took a number of years for me to put this all together and to put my strategies through this army of statistical tests. The end result is a portfolio of what I feel are really shiny, polished strategies that have survived all this rigorous statistical scrutiny and that I now happily put my money into.